

Introduction ‘Plot Graph in PowerShell Console’:
Recently, I was working on my Twitter bot (https://twitter.com/WittyHumorBot) completely written in PowerShell, but part of which was automating multiple jobs that run continuously on my screen. I managed to write a script to set all PowerShell consoles automatically in a grid layout like in the below image
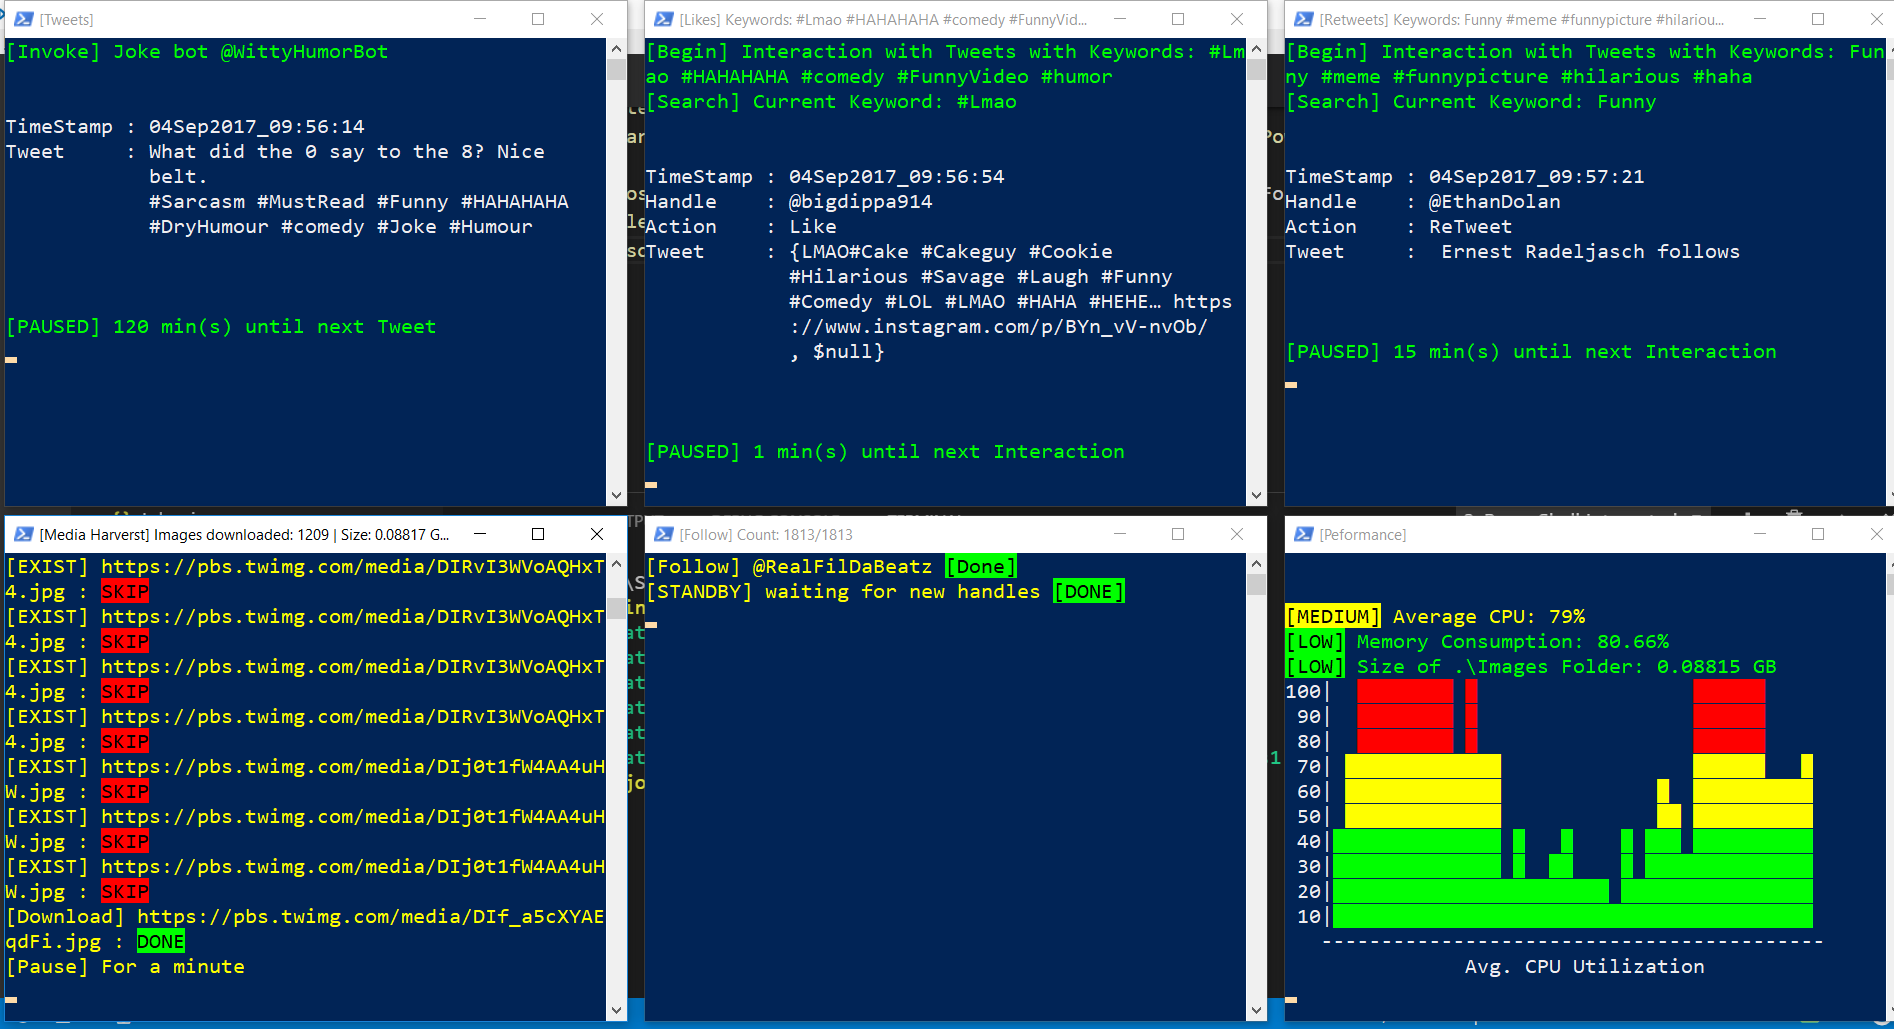

But I was not able to do that with taskmgr.exe in order to monitor performance bottlenecks and which was not at all customizable to my needs.


Features and Script:
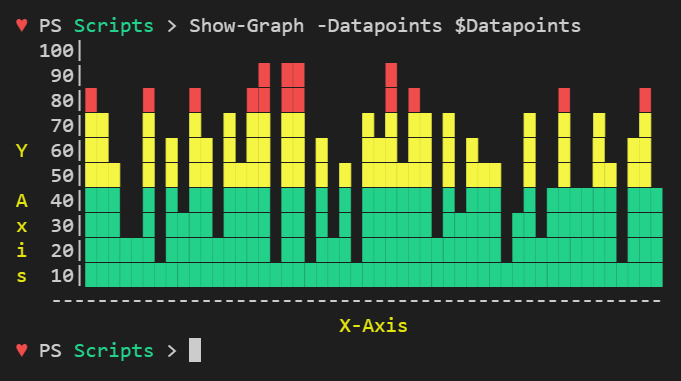
So I decided to write a function that is customizable and can display a graph in a Powershell console which can also be set in an Automated grid layout ( Here is the Grid layout script and the blog post).
Also,
- I want to Color-code the output depending upon the Value of the Datapoint; Above/below some predefined thresholds
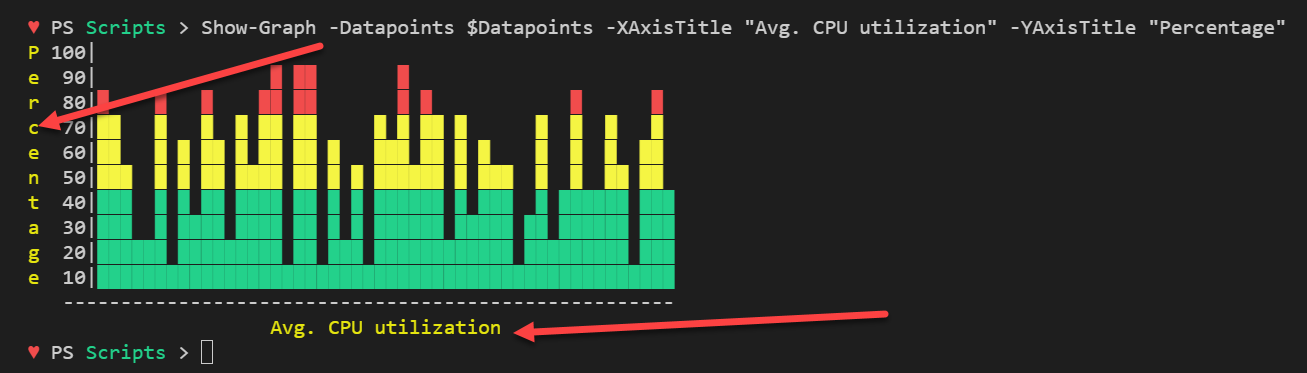
- Display custom information on X and Y-Axis labels
- A Graph in the console that is independent and fully customizable, not like Task Manager’s (no need to switch to Performance Tab) and,
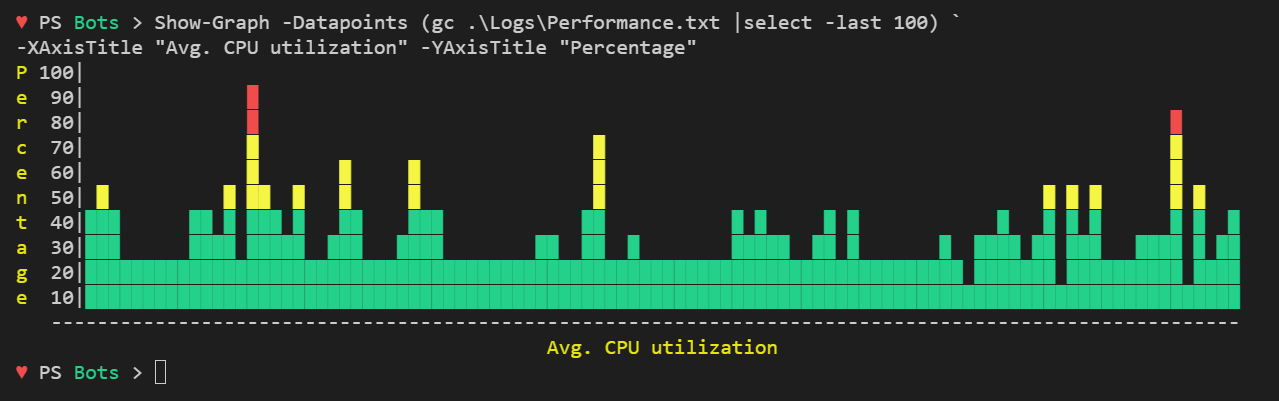
- which could be easily used in any Powershell script to monitor performance on any defined parameter, which I see as the biggest benefit of the function.
- The function consumes data points, generated during script execution or Pre-stored data like from a file or database.


Following is the full script and here is the link to the Github Project, please feel free to contribute as I still see some possibilities of improvement.
Hope you’ll find the script useful and Thanks for reading.
Please do follow me on twitter for more Interesting PowerShell material and don’t forget to Showoff your Powershell console graph to your colleagues, Cheers! 😉

